Thanks to all those who contributed to the ridership survey that we attempted over the past few weeks. We collected a total of 128 counts with at least one data point for every peak AM train.
| The final calculated results are tabulated to the right. Please note that these are NOT statistically or scientifically valid results. There are a lot of problems with this data, including: - The data collected is a mix of actual counts and estimates by many different people, so data collection methods probably varied widely; - Extrapolations of the passenger load on one coach (or even just one level of a bi-level coach) to an entire train. This is probably a valid assumption for heavily loaded trains, but probably NOT valid for trains with lighter loads; and - Assumptions to convert "standing room only" to an actual passenger count; and - Assumptions to convert all estimates reported using 'words' to actual values. In particular, the following trends seem to be self evident: - More data points were collected earlier in the effort. That leads me to believe that the earlier data may be more accurate. - There are some odd outliers in the data, which I haven't deleted. With the exception of Fridays, I don't think there is high variability from day-to-day for any particular train. The data shows variability that I don't believe is true. | 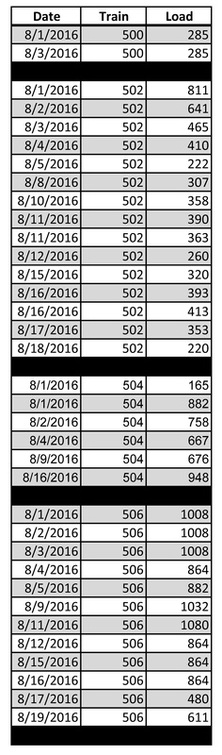 | 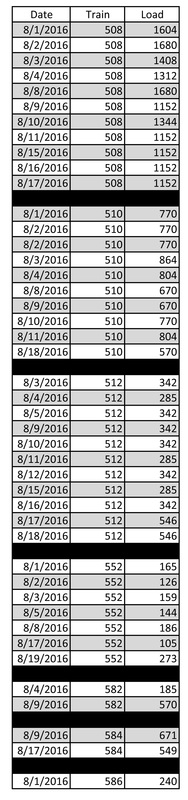 |
Frankly, I'm not too interested in doing a massive analysis of this data, since I'm more interested in the next blog post about my proposal to ease the overcrowding on P508.
However, the data does contain some nuggets that are worth reflecting on:
- As expected, P508 has very high ridership. The MBTA considers eight bi-levels as having a capacity of 1,440 passengers, based on the assumption that each bi-level coach has 180 seats (their is actually some minor variation, but 180 is a fair average). Eight bi-levels is the largest set size possible on the commuter rail at this time - the constraining factor is available rail storage areas for storing this size consist either overnight or during the mid-day. There just isn't a siding large enough to store a nine coach set on a regular basis. As we have all experienced, P508 is regularly exceeding 1,440 passengers.
- The Heart To Hub, P552, has around 150 passengers per trip. All of the counts for P552 were submitted by one rider, who counted all the passengers in the one coach they were sitting in. But (as per the methodology below) the only way to come up with a full load count was to assume that all the coaches in use had that same number of passengers. So I'm not confident that the data is exact, but it does generally match up with the values presented by the MBTA. The MBTA claims an average of:
May = 163
June = 160
July = 158
Methodology
The raw data, with all responses (personal data deleted), is available as an Excel file here if you want to play with it yourself.
Most people submitted estimates of ridership. Even where they counted, those counts were usually just for one coach or one level of a bi-level. So I needed a way to convert those counts into full train counts. So:
- Almost all of the data collected included the number of flats and number of bi-level coaches. I applied the same assumptions that the MBTA uses: flat = 114 seats and bi-level = 180 seats.
- Where there was an actual count submitted, I assumed that percentage was repeated throughout the entire train. For example, if someone submitted a count of 45 passengers on one level of a bi-level coach, I assumed the entire train was 50% full (45/90 = 50% (making the assumption that one level of a bi-level has 90 seats, which I know ignores the few seats in the lobbies, but we're making so many assumptions I'm not going to worry about that)).
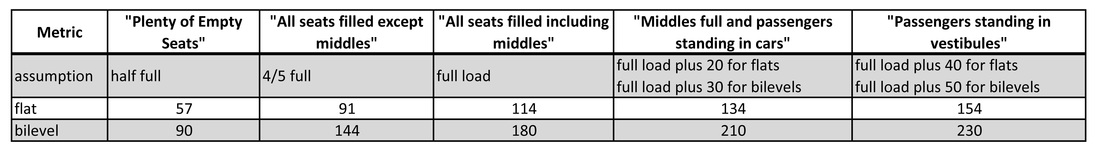
- The following table of assumptions shows how I converted 'word' / 'text description' estimates into values. These assumptions were applied to every coach in the consist.
However, the data does contain some nuggets that are worth reflecting on:
- As expected, P508 has very high ridership. The MBTA considers eight bi-levels as having a capacity of 1,440 passengers, based on the assumption that each bi-level coach has 180 seats (their is actually some minor variation, but 180 is a fair average). Eight bi-levels is the largest set size possible on the commuter rail at this time - the constraining factor is available rail storage areas for storing this size consist either overnight or during the mid-day. There just isn't a siding large enough to store a nine coach set on a regular basis. As we have all experienced, P508 is regularly exceeding 1,440 passengers.
- The Heart To Hub, P552, has around 150 passengers per trip. All of the counts for P552 were submitted by one rider, who counted all the passengers in the one coach they were sitting in. But (as per the methodology below) the only way to come up with a full load count was to assume that all the coaches in use had that same number of passengers. So I'm not confident that the data is exact, but it does generally match up with the values presented by the MBTA. The MBTA claims an average of:
May = 163
June = 160
July = 158
Methodology
The raw data, with all responses (personal data deleted), is available as an Excel file here if you want to play with it yourself.
Most people submitted estimates of ridership. Even where they counted, those counts were usually just for one coach or one level of a bi-level. So I needed a way to convert those counts into full train counts. So:
- Almost all of the data collected included the number of flats and number of bi-level coaches. I applied the same assumptions that the MBTA uses: flat = 114 seats and bi-level = 180 seats.
- Where there was an actual count submitted, I assumed that percentage was repeated throughout the entire train. For example, if someone submitted a count of 45 passengers on one level of a bi-level coach, I assumed the entire train was 50% full (45/90 = 50% (making the assumption that one level of a bi-level has 90 seats, which I know ignores the few seats in the lobbies, but we're making so many assumptions I'm not going to worry about that)).
- The following table of assumptions shows how I converted 'word' / 'text description' estimates into values. These assumptions were applied to every coach in the consist.
- There were a few instances where I manipulated the data manually. For example, where there were multiple results for one train on the same day, I chose or averaged the results to come up with one value for that train. I also manipulated some data where the type and number of coaches was not exact or was guessed. A very small number of counts were simply discarded because there wasn't enough information to create a train count (such as no report for number or type of coaches).
There is a ton of other interesting information such as lateness (the Heart to Hub was late for 6 of the 7 reported trips) in the data report. I'll definitely use it for my own knowledge, and I invite anyone else to take a look and see if they can glean some interesting facts from the data. I'd be glad to edit this blog post if someone finds something worth adding here.
There is a ton of other interesting information such as lateness (the Heart to Hub was late for 6 of the 7 reported trips) in the data report. I'll definitely use it for my own knowledge, and I invite anyone else to take a look and see if they can glean some interesting facts from the data. I'd be glad to edit this blog post if someone finds something worth adding here.
 RSS Feed
